Infections fall to three figures
Today Nova Scotia is reporting 842 new cases, which sounds like a lot but is actually a drop after three days of 1,000+ cases in a row. We will call this good news and welcome it happily, especially as we process the bad news of hospitalizations continuing to climb. Yesterday there were 40 infected people sick enough with COVID to be in the hospital, five of them so sick that they needed intensive care. Today 45 COVID patients are in hospital, eight of them in ICU.
In today's other provincial COVID news, we've got three reports stemming from today's Houstrang briefing:
Restrictions are extended to the end of January
Schools are going online for a week
Self-isolation is changing for omicron
Comparing active cases in the third and fourth waves
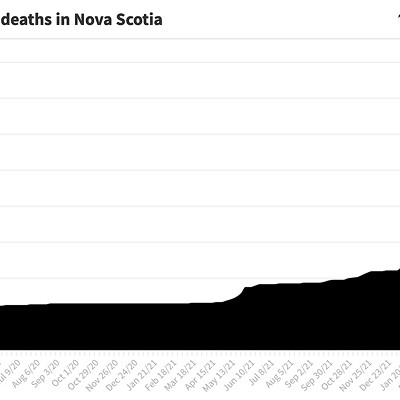
In December, the town of Antigonish became ground zero for an inter-provincial COVID outbreak due to a weekend of superspreader events connected to the annual presentation of X-Rings at St. Francis Xavier University. But how bad is the outbreak, really? The following chart lets you compare Nova Scotia's active cases, dating from the third wave in April through the fourth wave and its infection Xplosion, using case data from provincial pandemic reports. The chart will be updated when provincial reporting allows. Note: From Dec 10 through Dec 22, Nova Scotia was too overwhelmed by new COVID cases to report recoveries or an official active case count; the active case numbers on this graph for those dates have been calculated by adding each day's new cases to the last official active count, and are therefore a maximum active caseload. Starting Dec 23, the province is issuing an "estimated" number of active cases.
jump back to the top
New and active cases visualized
Nova Scotia's third wave of COVID grew in April, 2021, peaked in May (227 new cases in one day was the maximum) and subsided in June. On July 17, the province reached five active cases—its lowest level in more than eight months—and an election was called. So when it came time to reset The Coast's chart comparing daily new cases with that day’s active caseload, in order to better reflect disease levels after the third wave, we started from July 17. Two months later, on September 14, the province formally announced the arrival of the fourth wave of COVID. The dark purple line tracks the rise and fall of daily new infections reported by the province; the green area is the province's caseload. In mid-November, The Coast added a golden line to show the 7-day moving average of daily new cases, effectively a smoothed-out version of the purple line that puts the ups and downs into bigger context. Click or hover over any point on the graph and the detail for that moment will pop up. To focus on just some information, click the legend at the top left of the graph to hide or reveal that data set. Note: As of July 23, 2021, the province stopped updating case numbers on weekends. And you can click here for the version of this graph that includes the third wave and its May 10 crest of 1,655 active cases. Also, from Dec 10 through Dec 22, Nova Scotia was too overwhelmed by new COVID cases to report recoveries or an official active case count; the active case numbers on this graph for those dates have been calculated by adding each day's new cases to the last official active count, and are therefore a maximum active caseload. Starting Dec 23, the province is issuing an "estimated" number of active cases.
jump back to the top
Canadian cases 2021-22
There was a point in July 2021, when the delta variant was causing an increase in COVID infections around the world, that Canada seemed safe from the fourth wave. By August, however, that point had passed, and case numbers around the country started to rise again. This graph charts the number of new infections every day in each province and territory, using the 7-day moving average to mitigate single-day anomalies (including a lack of weekend reporting in several jurisdictions including British Columbia and Nova Scotia). To focus on individual places, click the place names at the top of the chart to turn that data on or off.
jump back to the top
Click here for yesterday's COVID-19 news roundup, for January 4, 2022.


