NOTE: This day is now over. Click for the latest on COVID-19 from The Coast. Or for an informative look back at Nova Scotia's evolving pandemic response, keep on reading.
Map of NS cases Cases in kids Table of community health networks New and active cases Vaccination rate Breakthrough infections Canada’s fourth wave
Briefing bombshells
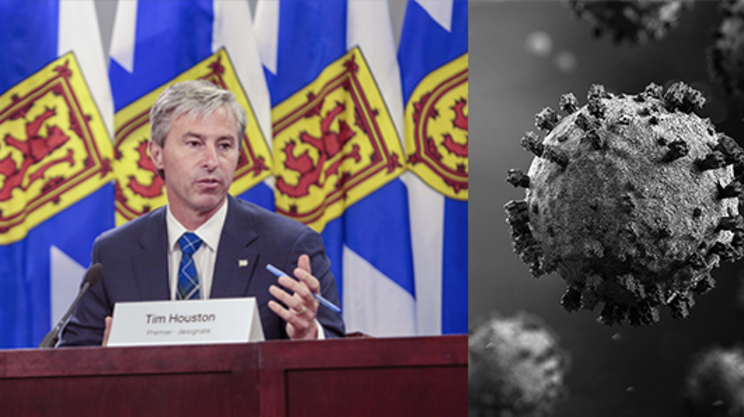
Remember back in the early days of the pandi, when St. Francis Xavier University was one of the first schools in Canada to reopen for in-person classes, which freaked some people out, but then X had a blissfully COVID-free fall term? That success probably got erased at today's provincial COVID briefing, where Doctor Strang explained that a recent X ring ceremony is looking like a superspreader event that's going to cause of bump of new infections in coming days. This big news, plus AstraZeneca's return, the expansion of the third-dose program and kids getting two extra days of Christmastime break from school are in our full briefing report.
22 cases and a broken data dashboard
Tuesday, December 7, 2021
Reopening status
Phase 5-ish
New cases
22
New recoveries
27
New deaths
0
Active cases
147
Total cases in Nova Scotia during pandemic
8,448
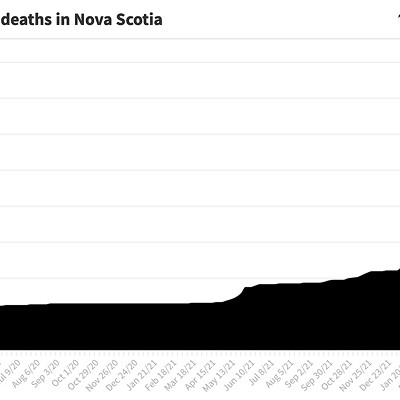
Total COVID deaths
110
Nova Scotia's Tuesday COVID-19 report arrives with annoying news. "The COVID-19 data dashboard is currently experiencing a technical issue and will be updated after the issue is resolved," says a note at the top of the report. The annoying part is that The Coast uses the data dashboard to uncover information that we use in many of our popular COVID graphs lower down on this page, so those graphs haven't been updated yet. And the only timeline from the government is that the data will be available as soon as the technical issue is fixed—whenever that might be later today, tomorrow or next week.
Relying exclusively on the written report, we learn that there are 22 new cases today, and that 27 people have recovered from COVID. The difference between 27 recoveries and 22 infections is five recoveries, so the active caseload should go down by five from yesterday's level of 153 active cases. But the written report says there are 147 active cases—a drop of six cases, not the expected five, since yesterday—so we also learn that the written report can be confusing all on its own, even without conflicting information coming from the data dashboard.
Assuming there really are 22 new cases, the province breaks them down this way: "There are 18 cases in Central Zone and four cases in Northern Zone. There is a cluster of cases in a localized community in Northern Zone and there is also evidence of limited community spread in Halifax and parts of northern Nova Scotia." That's all we can tell you at this point, because our map and table of COVID in the more localized community health networks rely completely on data from the dashboard.
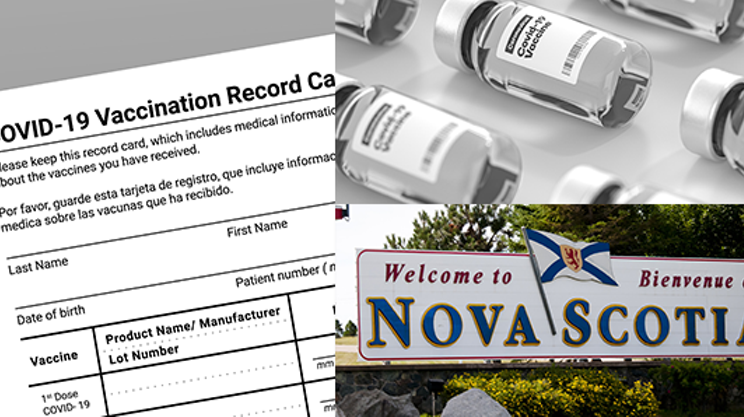
Nova Scotia reports vaccination totals in the written report, so the vaccination rate graph has been updated. But as you can see on the graph, the numbers reported by the province don't make sense because there is now a supposedly negative number of people who only have one shot. Our protracted discussion with the province has still not produced an explanation of the calculations behind the numbers, violating the commandment drilled into students in any math class to "show your work."
Today's report does mention something about vaccines that might help make sense of things: "The percentage of Nova Scotians with a third dose is now displayed on the COVID-19 data dashboard." Oh whoops, wrong thing from the report, because we've established the data dashboard is currently out of commission. Here's the right quote:
"The number of people who have received their second dose includes people who received the second outside Nova Scotia. Those will be removed over the coming days for consistency with the total number of doses administered in the province. This will not change Nova Scotia’s vaccination rate on the COVID-19 data dashboard."
This removal of people is clearly already happening—no need to wait for coming days to witness it in action. Yesterday, for example, the province said that 793,954 people have been fully vaccinated with two doses, while today that figure has gone down to 793,905 fully vaxxed folks, wiping 49 people off the board.
Our hope is that between third-dose data appearing at the dashboard, and a correction to the raw numbers coming soon and/or currently underway, we'll be able to figure out the province's otherwise opaque calculations and get our chart reporting a more plausible reality. Sometime later today, tomorrow or, the most likely scenario given that Team Coast is also in production for Thursday's print issue, next week.
Houstrang talks
Premier Tim Houston and chief medical officer of health Robert Strang are giving one of their occasional COVID-19 briefings today at 3pm. You can watch live at novascotia.ca/stayinformed/webcast and/or @nsgov on Facebook, or catch it later at the Nova Scotia government's YouTube page.
Map of cases in community health networks
This infographic was created by The Coast using daily case data from Nova Scotia's official COVID-19 dashboard. Our goal is for this to be the best NS COVID map around, clearer and more informative than the province or any other media organization provides. To get there we do an analysis of the data to find each day's new and resolved case numbers in the 14 community health networks, information the province does not provide. For a different but still highly accessible approach to the latest COVID statistics, check out our case table. Note: On July 23, 2021, Nova Scotia announced that it will no longer update case numbers on weekends.
jump back to the top
Case table of the health networks
The Coast uses data logged from Nova Scotia's official COVID-19 dashboard in order to provide this tabulated breakdown. The province reports the number of active cases in each of Nova Scotia's 14 community health networks, but we do the math to be able to report the new and resolved case numbers. We also map the data to provide a different view of the case information. Note: Effective July 23, 2021, the province no longer updates case numbers on weekends.
jump back to the top
New and active cases visualized
Nova Scotia's third wave of COVID grew in April, 2021, peaked in May (227 new cases in one day was the maximum) and subsided in June. On July 17, the province reached five active cases—its lowest level in more than eight months—and an election was called. So when it came time to reset The Coast's chart comparing daily new cases with that day’s active caseload, in order to better reflect disease levels after the third wave, we started from July 17. Two months later, on September 14, the province formally announced the arrival of the fourth wave of COVID. The dark purple line tracks the rise and fall of daily new infections reported by the province; the green area is the province's caseload. In mid-November, The Coast added a golden line to show the 7-day moving average of daily new cases, effectively a smoothed-out version of the purple line that puts the ups and downs into bigger context. Click or hover over any point on the graph and the detail for that moment will pop up. To focus on just some information, click the legend at the top left of the graph to hide or reveal that data set. Note: As of July 23, 2021, the province stopped updating case numbers on weekends. And you can click here for the version of this graph that includes the third wave and its May 10 crest of 1,655 active cases.
jump back to the top
Infections in Nova Scotian children 11 and younger
On December 1, 2021, two things happened that change the pandemic for Nova Scotians aged 11 and younger: the province started vaccinations for kids from five to 11 years old, and it imposed a travel ban to stop children under 12 from leaving Nova Scotia to participate in sporting events or arts performances. So at The Coast we were inspired us to graph infections in this population, dating back to October 4 when the provincial COVID data dashboard first started reporting infection information specifically for the 0-to-11 age group. While the number of infections in kids ages five to 11 was high enough around the end of November to necessitate the travel ban, vaccinations should bring the infection rate down by early 2022.
jump back to the top
Vaccination in the population
How many Nova Scotians already have one dose of vaccine? How many are fully vaccinated with two doses? And how close are we to the herd immunity goal of 75 percent of the province fully vaxxed? These questions are answered in our chart of the vaccination rate in Nova Scotia since the province started reporting these numbers in January 2021, breaking out people who've had a single dose separate from those who've had the full complement of two doses. (Here's more information about the 75 percent target and what it will take to get there.) Note: The province doesn't update vaccination numbers on weekends.
jump back to the top
Canadian cases in 2021
There was a point in July 2021, when the delta variant was causing an increase in COVID infections around the world, that Canada seemed safe from the fourth wave. By August, however, that point had passed, and case numbers around the country started to rise again. This graph charts the number of new infections every day in each province and territory, using the 7-day moving average to mitigate single-day anomalies (including a lack of weekend reporting in several jurisdictions including British Columbia and Nova Scotia). To focus on individual places, click the place names at the top of the chart to turn that data on or off.
jump back to the top
Breakthrough infections in Nova Scotia
On Fridays, the province's daily COVID report includes statistics about COVID breakthroughs—infections, hospitalizations and deaths among people who are fully or partially vaccinated. The province reports its numbers as a cumulative total: all the breakthrough cases dating from March 15, 2021 to the latest update. The Coast does an analysis to break the information about new cases down by each weekly reporting period, in order to offer our readers the following unique view of the same information, so you can better understand the fluctuations in breakthrough infections as they happen. Note: Our bar chart only dates back to June because the province didn't start this reporting until summer 2021.
jump back to the top
Click here for yesterday's COVID-19 news roundup, for December 6, 2021.