NOTE: This day is now over. Click for the latest on COVID-19 from The Coast. Or for an informative look back at Nova Scotia's evolving pandemic response, keep on reading.
Map of NS community health networks Table of community networks New and active cases Vaccination rate Canada’s fourth wave NS breakthrough infections
30 cases, but more recoveries
Thursday, October 7, 2021
Reopening status
Phase 5, but modified
New cases
30
New recoveries
36
New deaths
0
Active cases
247
Total cases in Nova Scotia during pandemic
6,893
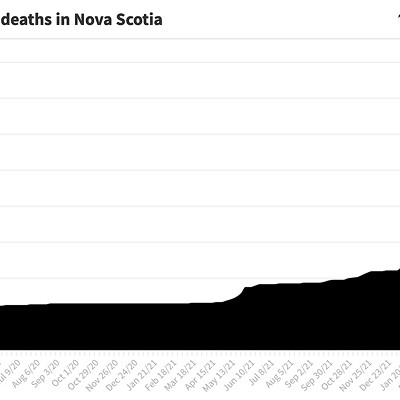
Total COVID deaths
98
Thursday's provincial pandemic update says the overwhelming majority of the 30 new cases are in Central zone—26 of them—with two cases in both the Western and Eastern zones. Our analysis of the NS data dashboard leads to our popular map and table of COVID in the province's community health networks, lower on this page. They show Halifax has the most new cases of any network, with 13, followed by Bedford/Sackville (six cases), then Dartmouth tied with the South Share at three new cases apiece.
We aren't sure how the South Shore network can have three new cases when the entire Western zone—made up of the South Shore, Annapolis Valley and Yarmouth/Shelburne/Digby networks—supposedly only has two cases. The province refuses to shed any light on this sort of discrepancy beyond parroting the boilerplate caveat in the report that "Cumulative cases may change as data is updated in [the monitoring system used by public health professionals, which is called] Panorama." Our table shows three cases in Western, 25 in Central and two in Eastern, which adds to the same 30 cases as the province's report (two Western, 26 Central, two Eastern).
The province says two schools were notified of COVID exposures yesterday, and helpfully offers a link to the exposures list. Unhelpfully, it doesn't just go ahead and say the schools in question are Bedford's Rocky Lake Elementary and Duc d’Anville Elementary in Halifax. Nor does the province do a little analysis of its own data to be able to inform the public how many of today's cases are in school-age Nova Scotians, so it's up to The Coast to provide that service: 10 cases are in the 0-11 age group, and only two are in the 12-19 group.
Finally, Nova Scotia's labs processed 4,201 COVID tests yesterday, which is down about 10 percent from yesterday. Vaccinations are also down, also by a similar amount from yesterday, to 3,397 jabs. The vaccination rate, however, continues its slow but inexorable climb, reaching 75.79 percent of the population fully vaxxed after passing the 75 percent mark on Monday.
Map of cases in community health networks
This infographic was created by The Coast using daily case data from Nova Scotia's official COVID-19 dashboard. Our goal is for this to be the best NS COVID map around, clearer and more informative than the province or any other media organization provides. To get there we do an analysis of the data to find each day's new and resolved case numbers in the 14 community health networks, information the province does not provide. For a different but still highly accessible approach to the latest COVID statistics, check out our case table. Note: On July 23, 2021, Nova Scotia announced that it will no longer update case numbers on weekends.
jump back to the top
Case table of the health networks
The Coast uses data logged from Nova Scotia's official COVID-19 dashboard in order to provide this tabulated breakdown. The province reports the number of active cases in each of Nova Scotia's 14 community health networks, but we do the math to be able to report the new and resolved case numbers. We also map the data to provide a different view of the case information. Note: Effective July 23, 2021, the province no longer updates case numbers on weekends.
jump back to the top
New and active cases visualized
Nova Scotia's third wave of COVID grew in April, 2021, peaked in May (227 new cases in one day was the maximum) and subsided in June. On July 17, the province reached five active cases—its lowest level in more than eight months—and an election was called. So when it came time to reset The Coast's chart comparing daily new cases with that day’s active caseload, in order to better reflect disease levels after the third wave, we started from July 17. Two months later, on September 14, the province formally announced the arrival of the fourth wave of COVID. The dark line tracks the rise and fall of new infections reported by the province; the green area is the province's caseload. Click or hover over any point on the graph and the detail for that moment will pop up. To focus on just new or active cases, click the legend at the top left of the graph to hide or reveal that data set. Note: As of July 23, 2021, the province stopped updating case numbers on weekends. And you can click here for the version of this graph that includes the third wave and its May 10 crest of 1,655 active cases.
jump back to the top
Vaccination in the population
How many Nova Scotians already have one dose of vaccine? How many are fully vaccinated with two doses? And how close are we to the herd immunity goal of 75 percent of the province fully vaxxed? These questions are answered in our chart of the vaccination rate in Nova Scotia since the province started reporting these numbers in January 2021, breaking out people who've had a single dose separate from those who've had the full complement of two doses. (Here's more information about the 75 percent target and what it will take to get there.) Note: The province doesn't update vaccination numbers on weekends.
jump back to the top
Canadian cases in 2021
There was a point in July 2021, when the delta variant was causing an increase in COVID infections around the world, that Canada seemed safe from the fourth wave. By August, however, that point had passed, and case numbers around the country started to rise again. This graph charts the number of new infections every day in each province and territory, using the 7-day moving average to mitigate single-day anomalies (including a lack of weekend reporting in several jurisdictions including British Columbia and Nova Scotia). To focus on individual places, click the place names at the top of the chart to turn that data on or off.
jump back to the top
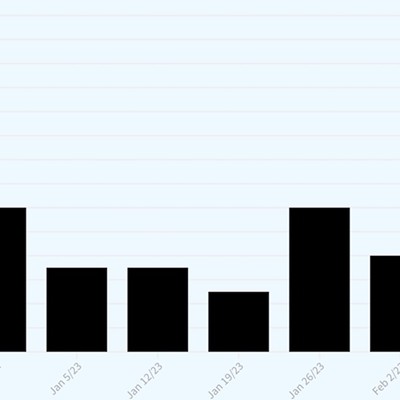
Breakthrough infections in Nova Scotia
On Fridays, the province's daily COVID report includes statistics about COVID breakthroughs—infections, hospitalizations and deaths among people who are fully or partially vaccinated. The province reports its numbers as a cumulative total: all the breakthrough cases dating from March 15, 2021 to the latest update. The Coast does an analysis to break the information about new cases down by each weekly reporting period, in order to offer our readers the following unique view of the same information, so you can better understand the fluctuations in breakthrough infections as they happen. Note: Our bar chart only dates back to June because the province didn't start this reporting until summer 2021.
jump back to the top
Click here for yesterday's COVID-19 news roundup, for October 6, 2021.