NOTE: This day is now over. Click for the latest on COVID-19 from The Coast. Or for an informative look back at Nova Scotia's evolving pandemic response, keep on reading.
Map of NS community health networks Table of community networks New and active cases Recoveries Daily average infections
A case at Citadel High School
Testing today turned up a positive case in someone connected to Citadel High School, which was announced in addition to the 13 new cases in the province's Wednesday report. "Because the case came in after the cut-off for reporting, it will not appear on the COVID-19 data dashboard until tomorrow, June 10," the province says.
The newly infected person was not at Citadel today, and for at least the next few days nobody else will be there, either. "The school will close to students until Monday, June 14, to allow for testing of close contacts and a deep cleaning of the school," says the province. "Students will learn from home during the closure beginning Thursday, June 10. Families and students will receive an update before June 14."
Although the "initial public health assessment has indicated a defined, limited number of close contacts," as the province puts it, all students and staff are encouraged to get tested. "No self-isolation is required while they wait for test results, unless they have been identified as a close contact by public health or have symptoms."
13 new cases, 20 recoveries
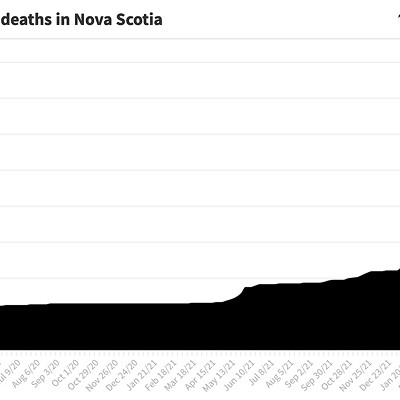
Back in April, when the third wave of infections started growing, every day there were more new cases being diagnosed than people recovering from COVID. So the active caseload grew. That wave reached its maximum height May 10 at 1,655 active cases (check the graph of active cases below). Then the caseload wandered down and up for almost a week, until reaching 1,531 active cases on May 16. After that, it's been all downhill, the caseload dropping every day to reach 164 active cases according to today's C19 report from the province.
But the number of recoveries is starting to dwindle. From yesterday to today, there were only 20 recoveries, the fewest since May 16. And with the province reporting 13 new cases today, the difference between new cases and recoveries is just seven. (Here is our chart of new cases and recoveries, which aims to show the tension between the two numbers by using what's called a stream graph instead of a standard line graph.)
In other words, the active caseload dropped by seven—still a drop, the 24th day of drops in a row, and as long as the caseload is dropping we have no complaints. However, as the smallest drop since that May 16 turning point, it's definitely cause for concern. Out of those 164 active COVID patients, let's hope for a couple dozen recoveries tomorrow to show the strength of our recovery.
The 13 new infections reported by the province are split as evenly as possible between the Central and Eastern health zone, seven cases in Central, six Eastern. Nine of the cases in the two zones are tied to travel or people having close contact with other COVID patients. Four of the cases—three in Central, one Eastern—are under investigation by public health professionals as potential community spread.
On our table and map that chart cases in the province's community health networks, you'll notice the Halifax, Dartmouth and Bedford/Sackville communities have nine new cases between them, even though all of Central zone only has seven new cases today. This is because two old cases got updated patient info in the provincial tracking database, therefore moved from what we call "Community not yet known" to get connected to Halifax, Dartmouth and/or Bedford/Sackville (that's the negative number in the table). Meaning it's possible Dartmouth only has new paperwork cases today, rather than new infections, but with the information the province provides it's impossible to know.
Hospitalizations are slightly down, from 17 COVID patients in hospital in yesterday's report, to 15 patients today. Unfortunately, for the third day in a row the number of those patients who are in intensive care hasn't changed from seven people in ICU.
Testing is well up since yesterday's report; the province says local labs completed 4,171 tests on Tuesday, compared to just over 2,500 on Monday. That's going in the right direction, as is the percentage of tests that came back positive. Those 4,171 tests uncovered 13 positive cases, for a percent positivity of .31, less than half the the .67 percent figure from yesterday.
Vaccinations, however, are essentially stagnant between yesterday and today. Clinics across Nova Scotia injected 4,886 arms on Tuesday, and 4,807 on Monday. The current daily average is over 7,500 doses of vaccine delivered. But there's a consistent pattern that Thursday's vax report shows a sharp rise in injections on Wednesday, giving us something to look forward to tomorrow.
Strankin speaks at 3
Premier Iain Rankin and chief medical officer of health Robert Strang are giving one of their regular COVID-19 briefings today. It is scheduled to start at 3pm, a time that was confirmed by the province this morning. You can watch live at novascotia.ca/stayinformed/webcast and/or @nsgov on Facebook, or catch it later at the Nova Scotia government's YouTube page.
Map of cases in community health networks
This infographic was created by The Coast using daily case data from Nova Scotia's official COVID-19 dashboard. Our goal is for this to be the best NS COVID map around, clearer and more informative than the province or any other media organization provides. To get there we do an analysis of the data to find each day's new and resolved case numbers in the 14 community health networks, information the province does not provide. For a different but still highly accessible approach to the latest COVID statistics, check out our case table.
jump back to the top
Case table of the health networks
The Coast uses data logged from Nova Scotia's official COVID-19 dashboard in order to provide this tabulated breakdown. The province reports the number of active cases in each of Nova Scotia's 14 community health networks, but we do the math to be able to report the new and resolved case numbers. We also map the data to provide a different view of the case information.
jump back to the top
New and active cases visualized
This interactive graph charts COVID activity in Nova Scotia's third wave, comparing daily new cases with that day’s active caseload. The dark line tracks the rise and fall of new infections reported by the province, which hit a Nova Scotian pandemic record high of 227 cases in a single day on May 7. The green area is the province's caseload, which peaked May 10 at 1,655 active cases. Click or however over any point on the graph and the detail for that moment will pop up. To focus on just new or active cases, you can click the legend at the top left of the graph to hide or reveal that data set.
jump back to the top
Recoveries and infections graphed
A person who tests positive for COVID-19 counts as a new case, the beginning of a problem for both the province and that person. The best ending to the problem is the patient recovers from the disease. This interactive chart compares how many problems started (the red area of new cases) to how many ended (the blue area's recoveries) each day in Nova Scotia's third wave, revealing growth trends along the way. Click or hover over any point on the graph and the detail for that day will pop up, to reveal exactly how quickly things change: May 7 had Nova Scotia's most-ever infections diagnosed in one day, 227 new cases, more than triple the 71 recoveries that day. Two weeks later, May 21, had a record recoveries, 197 in a day, more than double the 84 new cases. To focus on just new cases or recoveries, you can click the legend at the top left of the graph to hide or reveal that data set.
jump back to the top
Average and daily new cases
Knowing the average number of new cases Nova Scotia has every day—the orange area in this graph—is useful to show the trend of infections without one day's ups or downs distorting the picture. Having the daily new cases as well, the dark line on the graph, gives a sense of how each day compares to the average. We use the rolling (AKA moving or running) 7-day average of daily data reported by the province; here's a good explainer of what a rolling average is.
jump back to the top
Click here for yesterday's COVID-19 news roundup, for June 8, 2021.