NOTE: This day is now over. Click for the latest on COVID-19 from The Coast. Or for an informative look back at Nova Scotia's evolving pandemic response, keep on reading.
Map of NS community health networks Table of community networks New and active cases Recoveries Daily average infections Vaccination rate
One and one
Saturday, July 10, 2021
Reopening status
Phase 3
New cases
1
New recoveries
1
New deaths
0
Active cases
39
Days in a row with cases
17
Total cases in Nova Scotia during pandemic
5,866
Total COVID deaths
92
About today’s one new case, the province’s daily report says it’s “in Western Zone and is related to travel.” The Coast’s analysis of public stats says the freshly infected person is a man who lives in the South Shore community health network. He is somewhere in the 60-to-79-year-old age category. (Our map and table of COVID activity in the health networks show where the person who recovered today lives, as well as where the 39 active cases are.)
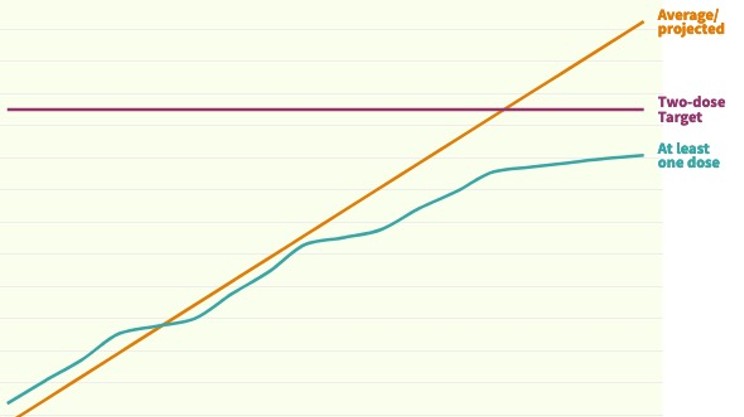
Local labs completed 3,277 tests Friday, which is back up above the current daily average, after below-average testing numbers reported for Thursday. Vaccination numbers aren’t reported on weekends, so we have no update after yesterday’s triumphant crossing of the lines on the chart (see below) to show that more Nova Scotians have two doses of vaccine than one dose.
Finally, for the third day in a row Nova Scotia has two COVID patients in hospital, with one of them is severe enough to require intensive care.
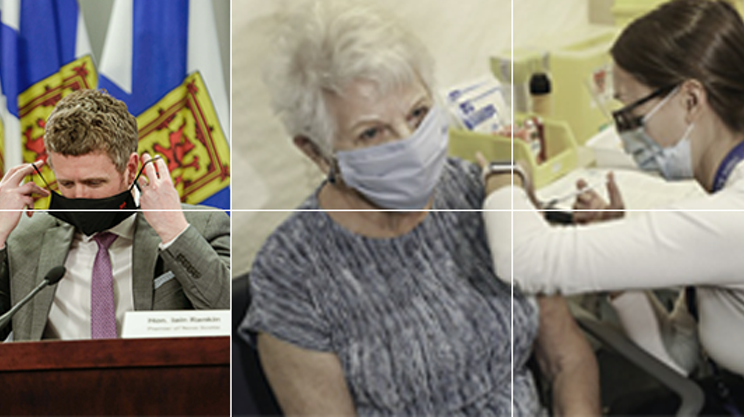
“Our daily case numbers are trending in the right direction, and I’m pleased to see another single digit day,” says premier Iain Rankin in the province’s report. “Nova Scotians have worked hard to get us to this point, and I want everyone to enjoy their summer. But we must stay vigilant, and get vaccinated, keep getting tested, and continue to look out for one another.”
Map of cases in community health networks
This infographic was created by The Coast using daily case data from Nova Scotia's official COVID-19 dashboard. Our goal is for this to be the best NS COVID map around, clearer and more informative than the province or any other media organization provides. To get there we do an analysis of the data to find each day's new and resolved case numbers in the 14 community health networks, information the province does not provide. For a different but still highly accessible approach to the latest COVID statistics, check out our case table.
jump back to the top
Case table of the health networks
The Coast uses data logged from Nova Scotia's official COVID-19 dashboard in order to provide this tabulated breakdown. The province reports the number of active cases in each of Nova Scotia's 14 community health networks, but we do the math to be able to report the new and resolved case numbers. We also map the data to provide a different view of the case information.
jump back to the top
New and active cases visualized
This interactive graph charts COVID activity in Nova Scotia's third wave, comparing daily new cases with that day’s active caseload. The dark line tracks the rise and fall of new infections reported by the province, which hit a Nova Scotian pandemic record high of 227 cases in a single day on May 7. The green area is the province's caseload, which peaked May 10 at 1,655 active cases. Click or however over any point on the graph and the detail for that moment will pop up. To focus on just new or active cases, you can click the legend at the top left of the graph to hide or reveal that data set.
jump back to the top
Recoveries and infections graphed
A person who tests positive for COVID-19 counts as a new case, the beginning of a problem for both the province and that person. The best ending to the problem is the patient recovers from the disease. This interactive chart compares how many problems started (the red area of new cases) to how many ended (the blue area's recoveries) each day in Nova Scotia's third wave, revealing growth trends along the way. Click or hover over any point on the graph and the detail for that day will pop up, to reveal exactly how quickly things change: May 7 had Nova Scotia's most-ever infections diagnosed in one day, 227 new cases, more than triple the 71 recoveries that day. Two weeks later, May 21, had a record recoveries, 197 in a day, more than double the 84 new cases. To focus on just new cases or recoveries, you can click the legend at the top left of the graph to hide or reveal that data set.
jump back to the top
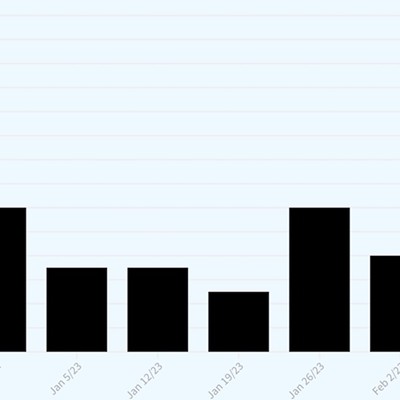
Average and daily new cases
Knowing the average number of new cases Nova Scotia has every day—the orange area in this graph—is useful to show the trend of infections without one day's ups or downs distorting the picture. Having the daily new cases as well, the dark line on the graph, gives a sense of how each day compares to the average. We use the rolling (AKA moving or running) 7-day average of daily data reported by the province; here's a good explainer of what a rolling average is.
jump back to the top
Vaccination in the population
How many Nova Scotians already have one dose of vaccine? How many are fully vaccinated with two doses? And how close are we to the herd immunity goal of 75 percent of the province fully vaxxed? These questions are answered in our chart of the vaccination rate in Nova Scotia since the province started reporting these numbers in January 2021, breaking out people who've had a single dose separate from those who've had the full complement of two doses. (Here's more information about the 75 percent target and what it will take to get there.) Note: The province doesn't update vaccination numbers on weekends.
jump back to the top
Click here for yesterday's COVID-19 news roundup, for July 9, 2021.